Scenario
I am a junior data analyst working in the marketing analyst team at Cyclistic, a bike-share company in Chicago. The director of marketing believes the company’s future success depends on maximizing the number of annual memberships. Therefore, my team wants to understand how casual riders and annual members use Cyclistic bikes differently. From these insights, my team will design a new marketing strategy to convert casual riders into annual members. But first, Cyclistic executives must approve my
recommendations, so they must be backed up with compelling data insights and professional data visualizations.
About the company
In 2016, Cyclistic launched a successful bike-share offering. Since then, the program has grown to a fleet of 5,824 bicycles that are geotracked and locked into a network of 692 stations across Chicago. The bikes can be unlocked from one station and returned to any other station in the system anytime.
Until now, Cyclistic’s marketing strategy relied on building general awareness and appealing to broad consumer segments. One approach that helped make these things possible was the flexibility of its pricing plans: single-ride passes, full-day passes, and annual memberships. Customers who purchase single-ride or full-day passes are referred to as casual riders. Customers who purchase annual memberships are Cyclistic members.
Cyclistic’s finance analysts have concluded that annual members are much more profitable than casual riders. Although the pricing flexibility helps Cyclistic attract more customers, Moreno believes that maximizing the number of annual members will be key to future growth. Rather than creating a marketing campaign that targets all-new customers, Moreno believes there is a very good
chance to convert casual riders into members. She notes that casual riders are already aware of the Cyclistic program and have chosen Cyclistic for their mobility needs.
A goal has been set: Design marketing strategies aimed at converting casual riders into annual members. In order to do that, however, the marketing analyst team needs to better understand how annual members and casual riders differ, why casual riders would buy a membership, and how digital media could affect their marketing tactics. The team is interested in
analyzing the Cyclistic historical bike trip data to identify trends.
Questions that will guide the future marketing program:
- How do annual members and casual riders use Cyclistic bikes differently?
- Why would casual riders buy Cyclistic annual memberships?
Company’s Database/Data Cleaning and Processing
Index of bucket “divvy-tripdata”
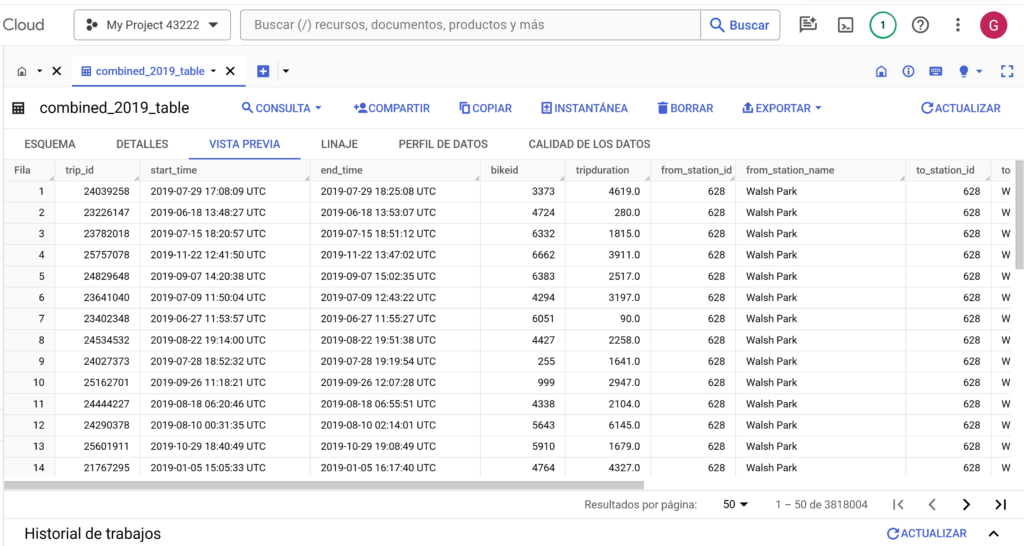
Datasets which were put together into one single dataset to analyse all the information in an easier way

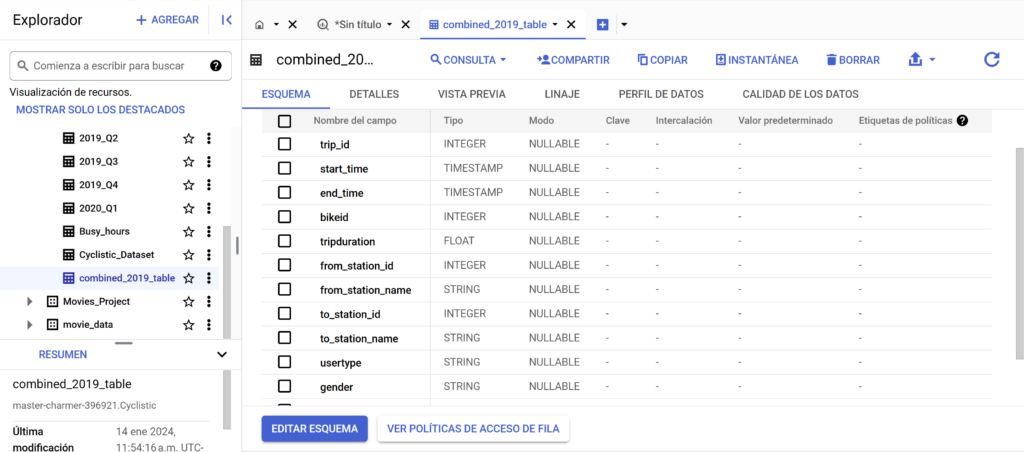
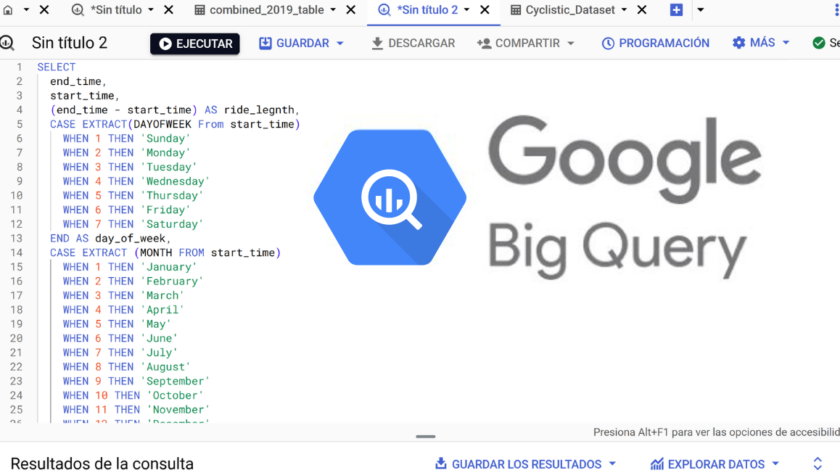
Based on the end_time and start_time columns we can get valuable information such as the ride length, day and month extraction, which we will add as columns to use for further analysis
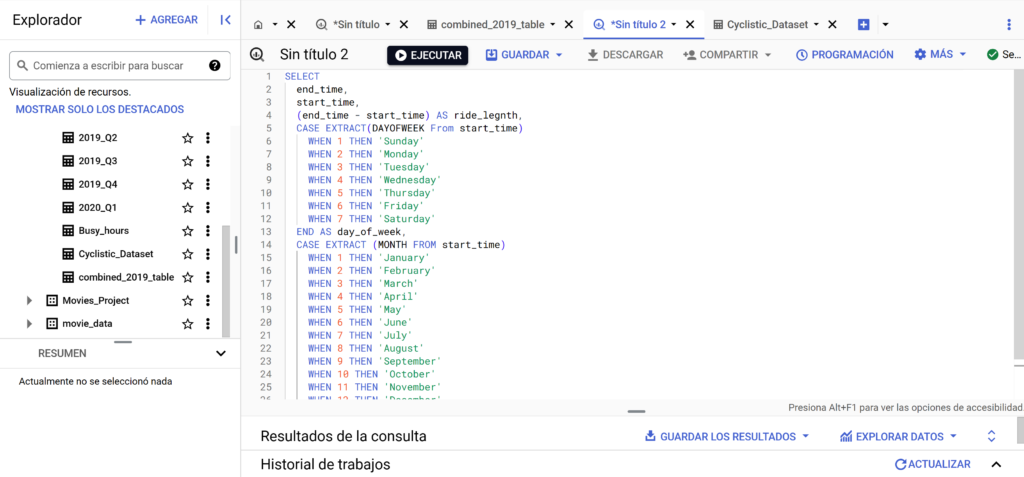
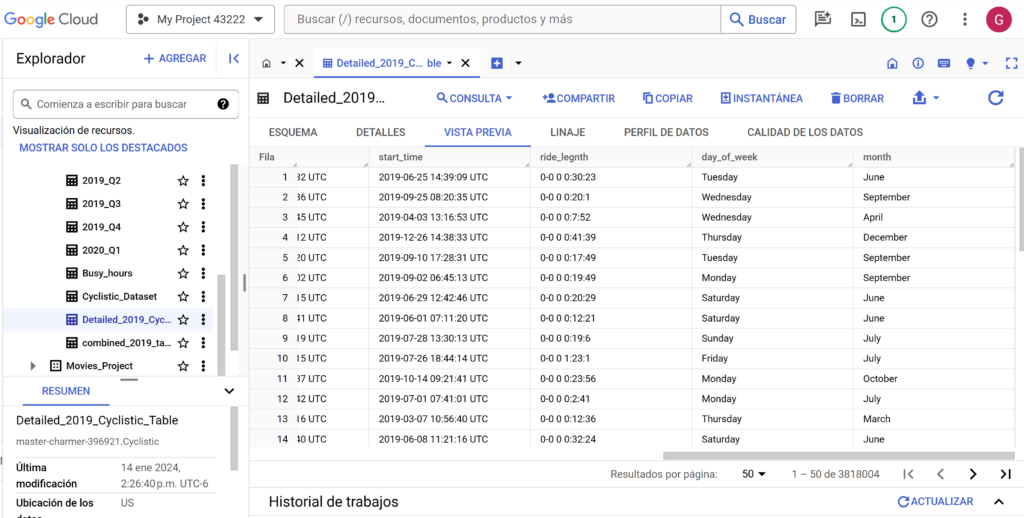
Understanding User Behavior:
- Do annual members and casual riders use different types of Cyclistic bikes (standard, reclining, hand tricycles, cargo bikes)?
- What is the average ride duration for members and casual riders, and does it vary by day of the week or time of day?
- Which docking stations are the most popular among members and casual riders, and are there any geographical patterns?
- How does weather (temperature, precipitation) affect ridership for members and casual riders differently?
- Can you identify any seasonal trends in bike usage for both member and casual rider groups?
Identifying Factors for Conversion:
- Are there any demographic factors (age, gender, income) that are associated with a higher likelihood of conversion from casual rider to member?
- Do riders who use Cyclistic bikes more frequently in a given period (e.g., month) have a higher probability of becoming members?
- Can you identify any specific trip patterns (distance, duration, station usage) that are predictive of potential membership conversion?
- Do certain marketing channels (email, social media, etc.) seem to be more effective in attracting potential members?
- Can you quantify the impact of different pricing plans (single-ride, full-day, annual membership) on user behavior and conversion rates?
Exploring Deeper Insights:
- Are there any hidden clusters or segments within the member and casual rider groups with distinct characteristics?
- Can you develop a predictive model to identify casual riders who are most likely to convert to members in the future?
- How can you use sentiment analysis of social media data to understand user perceptions of Cyclistic and potential areas for improvement?
- Can you measure the effectiveness of A/B testing different marketing campaign elements (images, messaging, call to action) on conversion rates?
- What are the potential long-term benefits (increased revenue, brand loyalty) of successfully converting casual riders into members?
- Can you identify any potential biases or limitations in the Cyclistic trip data, and how might they affect your analysis?
- How can you ensure your data analysis process is ethically sound and respects user privacy?
- Imagine you have access to additional data sources (weather, demographics, traffic patterns) – how would you incorporate them into your analysis?
- Develop a hypothetical new marketing campaign targeting specific segments of casual riders based on your findings. What would it look like?
- Present your key findings and recommendations to a skeptical audience of Cyclistic executives. How would you build a compelling narrative to win their support?
